Financial overview: 2009
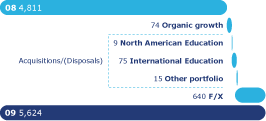
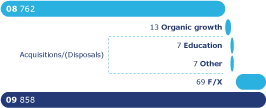
In 2009, Pearson's sales increased 4% at constant exchange rates to £5.6bn and adjusted operating profit 4% to £858m. Portfolio changes contributed 2% to sales and 2% to operating profit, largely in our education company. In underlying terms (ie, stripping out the benefit of both portfolio changes and currency movements), sales and operating profits increased by 2%.
Currency movements had a significant impact on reported results in 2009, adding £640m to sales and £69m to operating profit and contributing to headline sales and operating profit growth of 17% and 13% respectively. The currency impact was largely the result of the strengthening of the US dollar against sterling: we generated approximately 60% of our sales and profits in US dollars and the average exchange rate strengthened from £1:$1.85 in 2008 to £1:$1.57 in 2009.
Adjusted earnings per share were 65.4p, up 13% on a headline basis.
Operating cash flow increased by £117m to £913m (headline growth of 15%) and total free cash flow by £92m to £723m, or 90.5p per share (headline growth of 14%). Cash conversion was once again strong at 106% of operating profit and our ratio of average working capital to sales improved by a further 1.0% point. Our tax rate in 2009 was 25.5%, a little lower than in 2008.
Our return on average invested capital showed a headline reduction of 0.3% points to 8.9%, largely due to the impact of transaction foreign exchange on earnings. ROIC remains above our weighted average cost of capital.
Statutory results show an increase of £79m in operating profit to £755m (£676m in 2008). Basic earnings per share for continuing businesses were 53.2p in 2009, up from 47.9p in 2008.
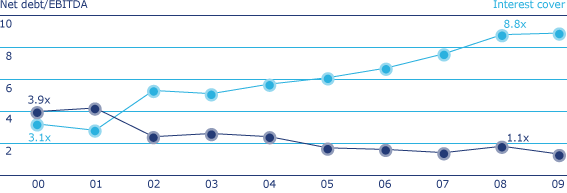
Net debt was £368m lower at £1,092m (£1,460m in 2008). Since 2000, Pearson's net debt/EBITDA ratio has fallen from 3.9x to 1.1x and our interest cover has increased from 3.1x to 8.8x.
Dividend. The board is proposing a dividend increase of 5.0% to 35.5p, subject to shareholder approval. 2009 will be Pearson's 18th straight year of increasing our dividend above the rate of inflation. Over the past five years we have increased our dividend at a compound annual rate of 6%. Our dividend cover is now 1.8x.
Balance sheet strength


